The Problem
Most website owners have no idea why visitors leave without converting. Tools like Google Analytics give you bounce rates and traffic numbers — but not the answer. You still have to dig through dashboards, interpret heatmaps yourself, and guess what to fix. Small business owners don't have time for that.
What I Built
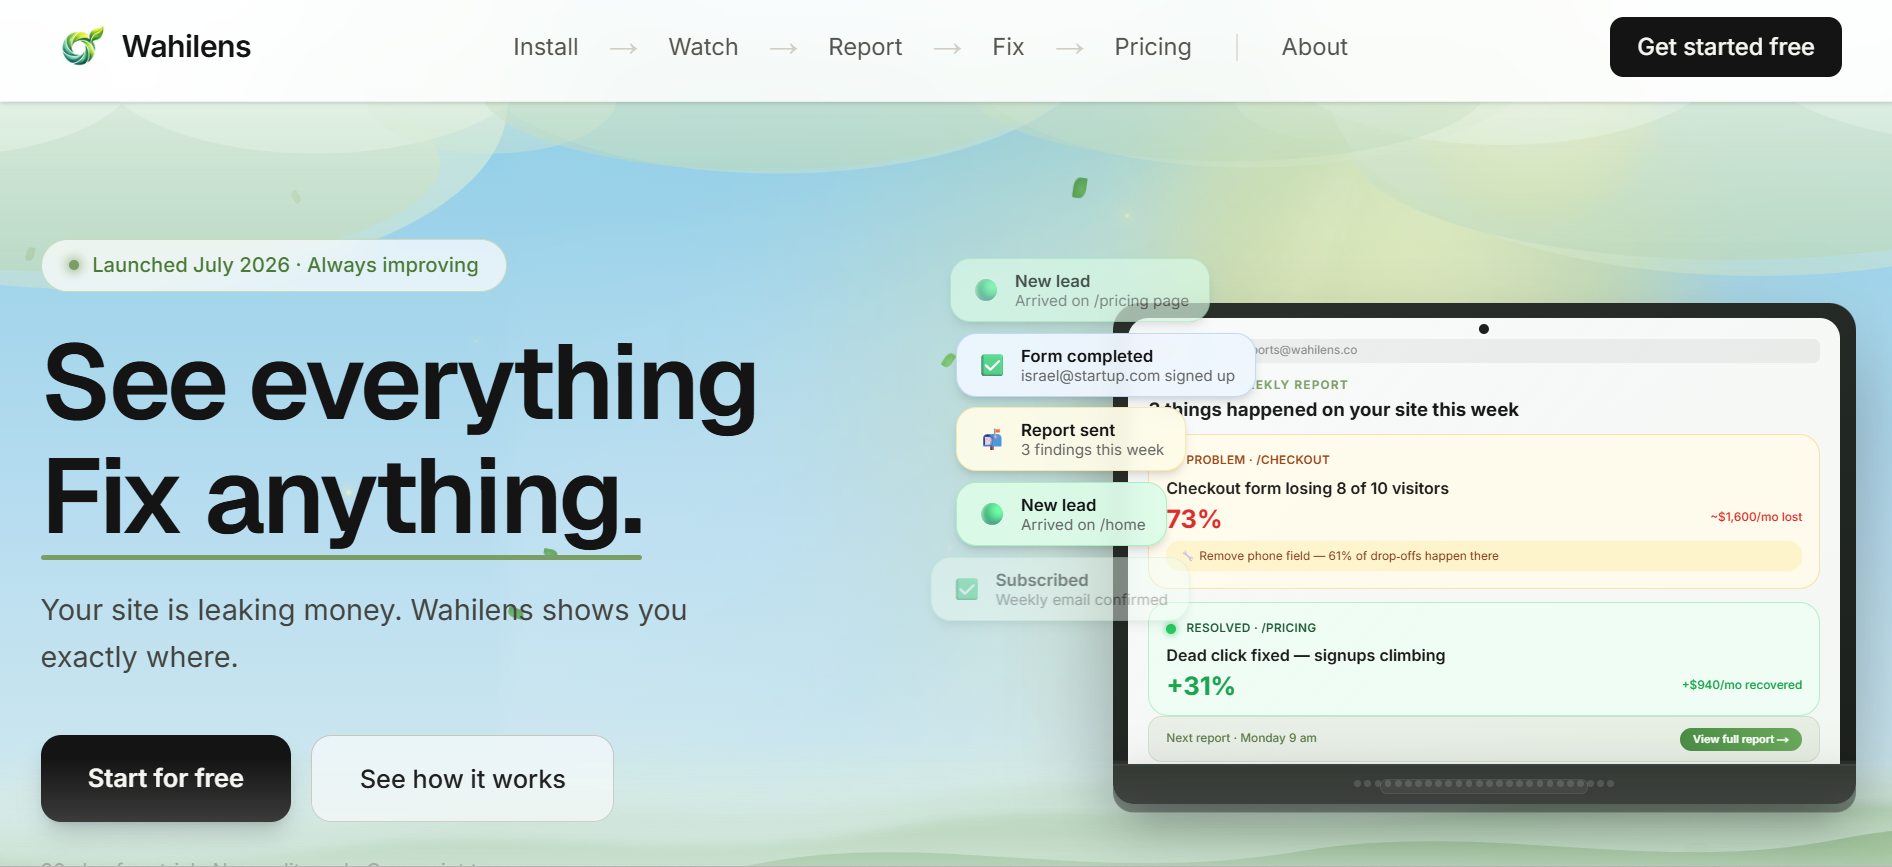
Wahilens is a drop-in analytics tool that watches every session all week — rage clicks, dead clicks, form drop-offs, scroll depth, time on page — then sends a plain-English Monday morning email telling you exactly what to fix, ranked by revenue impact. One script tag installs it on any site. No configuration, no events to define, no dashboards to check. An AI coach is built in so you can ask why visitors leave and get a dollar figure back.
How It Works
A lightweight tracker script (under 4kb, fully async) captures every interaction silently. A Django backend processes events, runs six detection algorithms across scroll depth, CTA visibility, form abandonment, rage clicks, dead clicks, and time on page, then generates findings ranked by severity. A weekly GitHub Actions job aggregates the data, computes revenue impact estimates, and sends personalised email reports via Resend. The AI coach is powered by OpenRouter and has full context of every finding on the site.
The Result
Launched July 2026. Wahilens tracks real sites in production, detects issues automatically, and sends weekly reports without any manual input from the site owner. The whole system — from tracking event to inbox report — runs without anyone touching a dashboard.